As I wrote in the previous post regarding debugging on the macOS environment, I figured out a way to avoid the Restart (Ctrl+Shift F5) and Disconnect (Shift+F5) operation issues I found in my past Visual Studio Code on Ubuntu post. So, I tested my finding on Ubuntu also.
At first, I edited the /etc/group file to add my Ubuntu account to the plugdev group (ncpin is my account name on Ubuntu).
/etc/group
[before]
plugdev:x:46:admin-user

[after]
plugdev:x:46:admin-user,ncpin
By doing this, I didn’t have to use the sudo command when I run the openocd command anymore. Since the Linux kernel sets the user group of the WCH-Link USB device to the plugdev group when the kernel detects the device according to the udev rule file /etc/udev/rules.d/50-wch.rules that I copied before, and if a user does not belong to the plugdev group, the user will need root privilege to access the WCH-Link USB device from a process like the openocd command.
I added the following line to the end of OpenOCD’s wch-riscv.cfg file.
$_TARGETNAME.0 configure -event gdb-detach { shutdown }
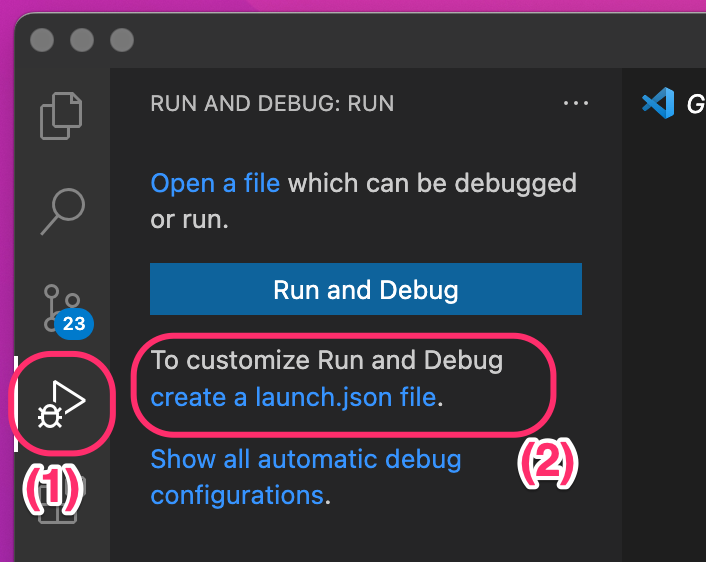
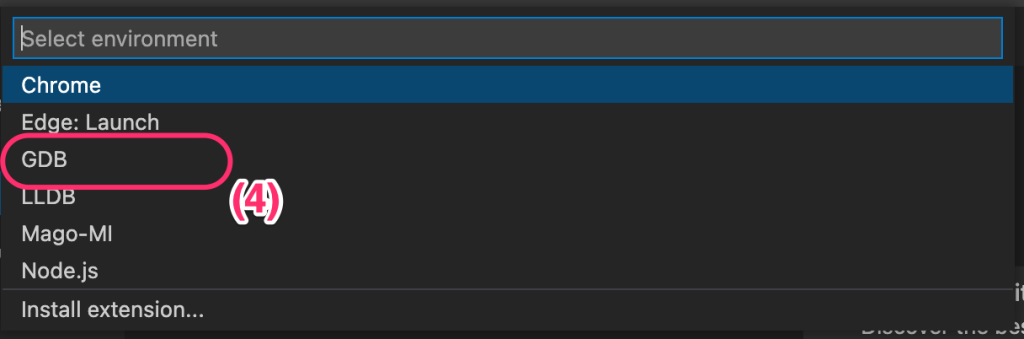
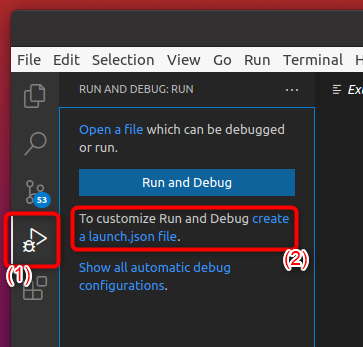
I replaced the contents of Visual Studio Code’s code-workspace JSON file as follows.
{
"tasks": {
"version": "2.0.0",
"tasks": [
{
"label": "run_openocd",
"type": "process",
"isBackground": true,
"command": "${workspaceRoot}/openocd",
"args": ["-f", "${workspaceRoot}/wch-riscv.cfg"],
"problemMatcher": [
{
"pattern": [
{
"regexp": ".",
"file": 1,
"location": 2,
"message": 3
}
],
"background": {
"activeOnStart": true,
"beginsPattern": ".",
"endsPattern": "."
}
}
]
}
]
},
"folders": [
{
"path": "."
}
],
"launch": {
"version": "0.2.0",
"configurations": [
{
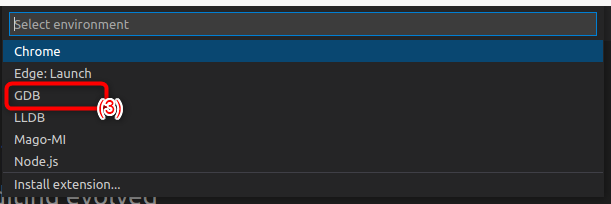
"name": "gdb-openocd",
"type": "gdb",
"request": "attach",
"executable": "exiti0.elf",
"remote": true,
"target": ":3333",
"cwd": "${workspaceRoot}",
"gdbpath": "riscv32-unknown-elf-gdb",
"preLaunchTask": "run_openocd",
"autorun": [
"set mem inaccessible-by-default off",
"set architecture riscv:rv32",
"set remotetimeout unlimited",
"monitor reset halt",
"load"
]
}
]
}
}
(Please note that this setting file assumes that both the openocd command and the wch-riscv.cfg file exists at the workspace root directory of the Visual Studio Code project)
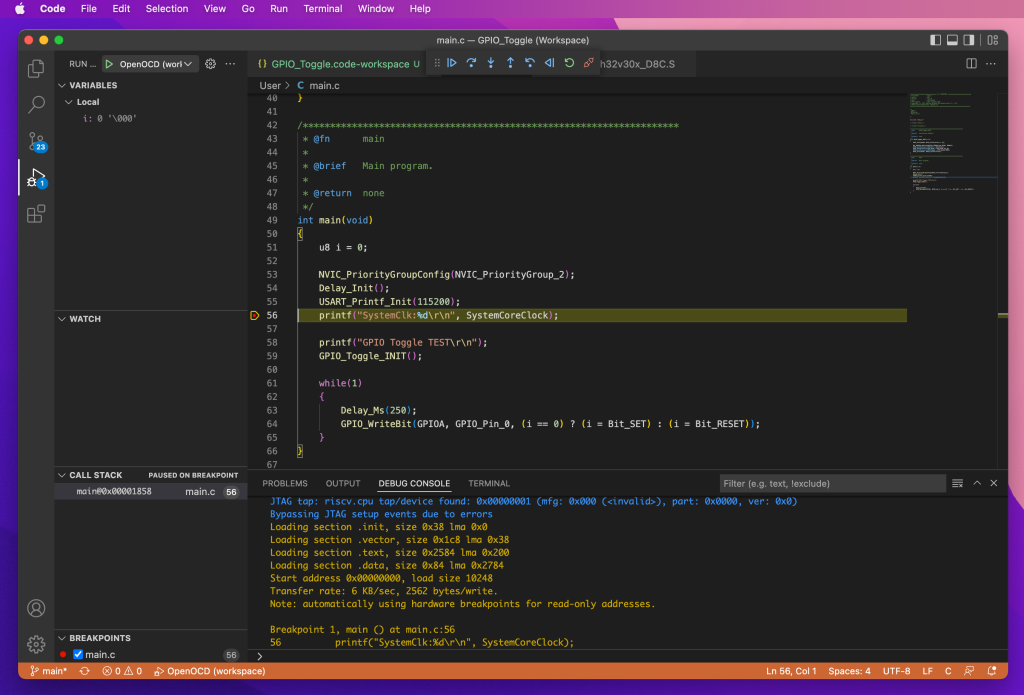
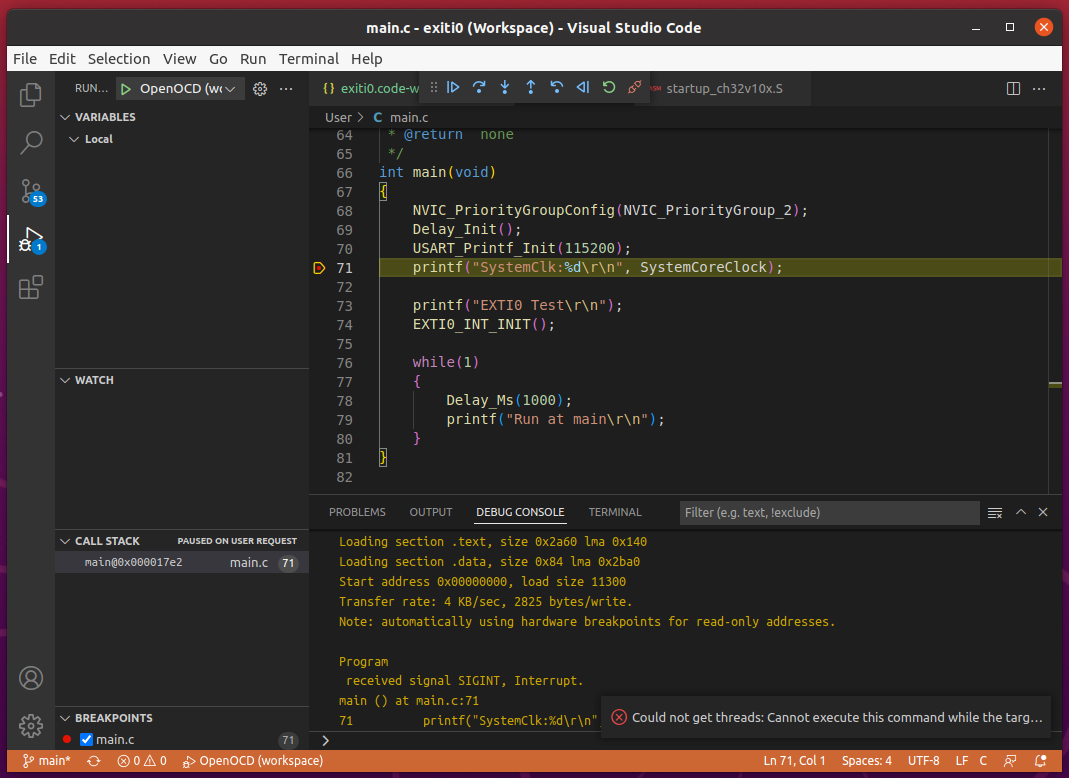
With the above changes, I no longer needed to run the openocd command separately. When I started the debug operation, Visual Studio Code automatically ran the openocd command in the background, and the launched openocd command stopped when I chose the Restart (Ctrl+Shift F5) and Disconnect (Shift+F5) command. And I was able to start debugging again also, unlike before.