As part of testing GDB in the previous post, I checked to see if I could also debug the CH32V103R Mini Evaluation board with Visual Studio Code.
After installing Visual Studio Code, I added the Native Debug extension by WebFreak. This extension is mandatory for the following process.
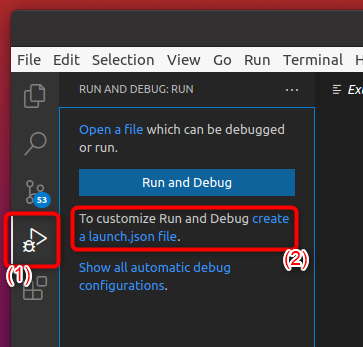
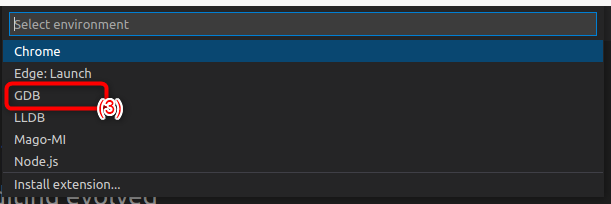
At first, I saved a workspace of Visual Studio Code into the ch32v103/EVT/EXAM/EXTI/EXTI0/User/ directory that I used in the previous post and added this directory to the workspace also. Then I created a launch.json file by clicking create a launch.json file(1), (2) and selecting the GDB(3) item.
I replaced the contents of the created JSON file with the following.
{
	"folders": [],
	"launch": {
		"version": "0.2.0",
		"configurations": [
			{
				"name": "OpenOCD",
				"type": "gdb",
				"request": "attach",
				"executable": "exiti0.elf",
				"remote": true,
				"target": ":3333",
				"cwd": "${workspaceRoot}",
				"gdbpath": "riscv32-unknown-elf-gdb",
				"autorun": [
					"set mem inaccessible-by-default off",
					"set architecture riscv:rv32",
					"set remotetimeout unlimited",
					"interrupt",
					"monitor reset halt",
					"load"
				]
			}
		]
	}
}
Before starting the debugging with Visual Studio Code, I ran the openocd in a different terminal.
sudo ./openocd -f wch-riscv.cfg
I set a breakpoint in main.c and started debugging by selecting the Start Debugging (F5) item under the Run menu.
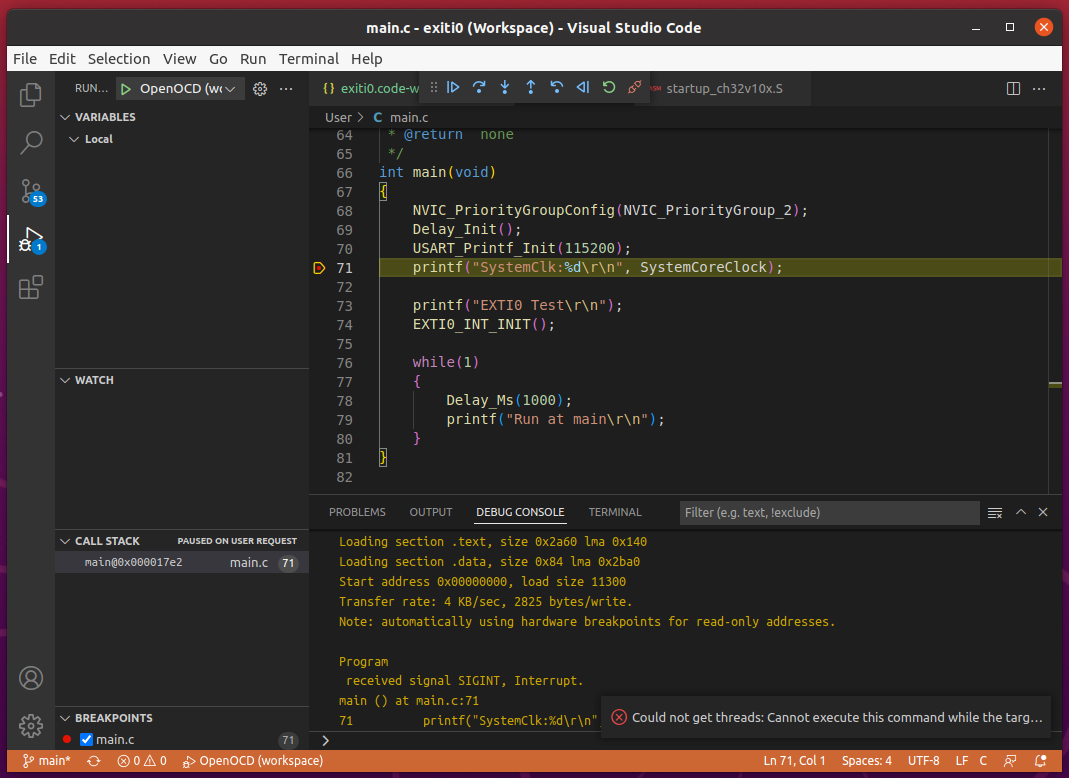
One thing I noticed is that Restart (Ctrl+Shift F5) and Disconnect (Shift+F5) didn’t work properly. I saw that openocd outputted libusb-related errors after those two commands. I was able to start debugging again by restarting the openocd process and selecting Start Debugging (F5). Other than those two it looked that debugging on Visual Studio Code worked as expected.
[Added on 2022-06-24]
I wrote a new blog that addressed how to solve Restart (Ctrl+Shift F5) and Disconnect (Shift+F5) operation issue in the above. Please check my new post in addition to this entry.